Exercise: Day 1 - Introduction to R
Get the data
Download the following data of from https://tcga-data.nci.nih.gov/docs/publications/gbm_exp/.
unifiedScaledFiltered.txt - Filtered unified gene expression estimate for 202 samples and 1740 genes
Load the data into R
Do this by either first downloading the file and providing the local path:
#replace location with local path_to_file
my_data <- read.table("../unifiedScaledFiltered.txt",sep="\t",header=1)
..or by reading the file directly from the remore location:
#source("https://bioconductor.org/biocLite.R") #run if necessary
#biocLite("curl") #run if necessary
library(curl)
my_data <- read.table(curl("https://tcga-data.nci.nih.gov/docs/publications/gbm_exp/unifiedScaledFiltered.txt"),sep="\t",header=1)
Data handling
A. Verify the number of columns and the number of rows. Are the samples the rows or the columns?
## [1] 1740 202
## [1] 202
## [1] 1740
B. What is the meaning of each number in the matrix? Verify your answer by computing and evaluating the mean for each column and row. Show a small subset of the results.
##         FSTL1          MMP2         BBOX1          GCSH          EDN1
##  2.970297e-07 -9.900990e-08  3.465347e-07 -2.475248e-07  2.475248e-07
##         CXCR4
## -9.900990e-08
## TCGA.02.0001.01C.01 TCGA.02.0002.01A.01 TCGA.02.0003.01A.01
##         0.177161391         0.312827282         0.286643540
## TCGA.02.0004.01A.01 TCGA.02.0006.01B.01 TCGA.02.0007.01A.01
##         0.142784023         0.394513443         0.002934747
C. What are the minimum and maximum values for each gene? For each sample? Show a small subset of the results for each calculation.
##   FSTL1    MMP2   BBOX1    GCSH    EDN1   CXCR4
## 2.57283 3.05396 1.84297 1.62990 2.09741 2.15870
##    FSTL1     MMP2    BBOX1     GCSH     EDN1    CXCR4
## -2.92885 -2.80437 -4.53120 -1.89212 -1.28751 -3.04210
## TCGA.02.0001.01C.01 TCGA.02.0002.01A.01 TCGA.02.0003.01A.01
##             3.60942             3.74107             3.99387
## TCGA.02.0004.01A.01 TCGA.02.0006.01B.01 TCGA.02.0007.01A.01
##             6.92775             3.94497             5.00777
## TCGA.02.0001.01C.01 TCGA.02.0002.01A.01 TCGA.02.0003.01A.01
##            -4.41469            -4.67118            -2.75794
## TCGA.02.0004.01A.01 TCGA.02.0006.01B.01 TCGA.02.0007.01A.01
##            -3.49348            -4.75532            -4.34894
D. Which gene has the largest standard deviation?
## RPS4Y1
##    567
## [1] 3.3467
E. What is the overall highest expression value? Which gene and for which sample?
## [1] 6.92775
## TCGA.02.0004.01A.01
##                   4
## ASPN
##  989
## [1] 6.92775
## [1] 6.92775
Plotting
Use the original data matrix of 202 samples and 1740 genes.
A. Plot a histogram of the gene expression values across samples for the EGFR gene. 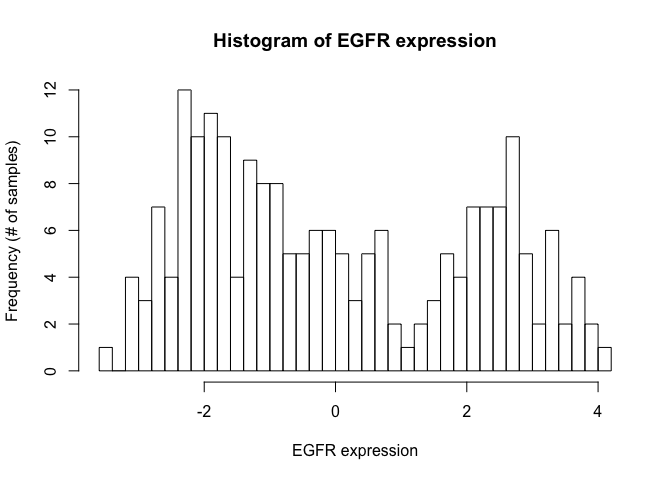
B. Plot an x-y scatterplot of EGFR versus IDH1 expression levels. 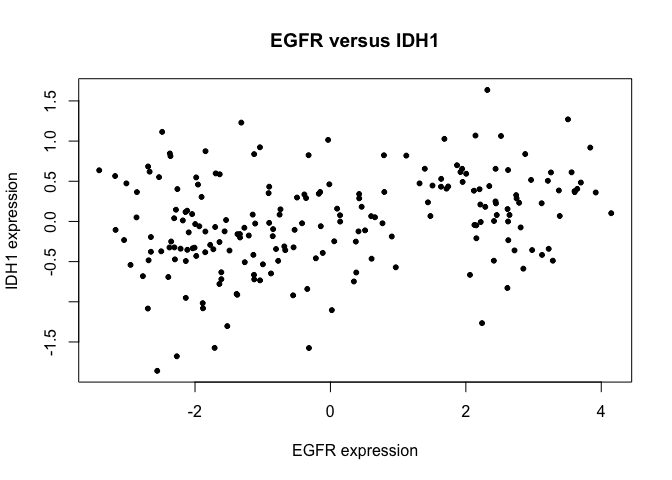
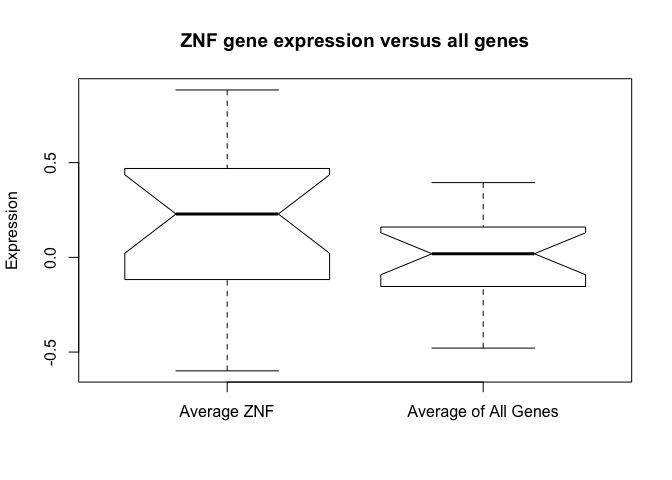
C. Gather a subset of genes that are zinc-finger nucleases whose gene names contain the letters “ZFN”. Hint: the function “grep” can be used to search for string matches. Also, you can use the function “rownames” to return a list of the row names.
- How many ZFN’s are there?
## [1] 17
- What are their row numbers?
##  [1]   24   56  238  322  626  629  634  756  758  968  993 1085 1342 1361
## [15] 1492 1615 1641
- What are their names?
##  [1] "ZNF83"  "ZNF228" "ZNF43"  "ZNF184" "ZNF423" "ZNF573" "ZNF415"
##  [8] "ZNF124" "ZNF217" "ZNF536" "ZNF84"  "ZNF22"  "ZNF711" "ZNF177"
## [15] "ZNF91"  "ZNF292" "ZNF659"
- Create a boxplot showing thier expression levels versus all of the genes. Use average values for each sample.
Functions
Use the original data matrix of 202 samples and 1740 genes, or first test on a smaller vector:
my_vector <- c(10,5,2,6,8,4,1,9,3,7)
A. Create a function that performs a selection sort on a vector and returns the vector in ascending order.
## [1] 1 2 3 4 5 6 7 8 9 10
B. Modify the function to return the original vector’s indexes from sorting the values in ascending order
## [1] 7 3 9 6 2 4 10 5 8 1