Grammar toolkit (udi-toolkit)
udi-toolkit is the reference implementation of the Universal Discovery Interface
(UDI) Grammar. It provides the grammar type definitions plus UDIVis — a component
that renders a UDI grammar spec as an interactive visualization — and a set of
headless data APIs.
The Grammar is defined with TypeScript typings in
GrammarTypes.ts. The JSON Schema
(UDIGrammarSchema.json) is generated from it via
pnpm build-schema.
The grammar
Section titled “The grammar”The Grammar maps variables to visual encodings. For instance, to create a scatterplot of height and weight we can map height_value to x and weight_value to y from the example donors.tsv file.
{ "source": { "name": "donors", "source": "./data/hubmap/donors.tsv" }, "representation": { "mark": "point", "mapping": [ { "encoding": "y", "field": "height_value", "type": "quantitative" }, { "encoding": "x", "field": "weight_value", "type": "quantitative" } ] }}Resulting in a visualization that would look like:
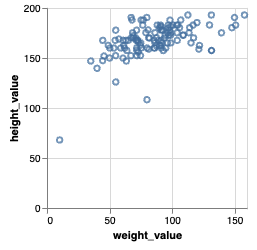
Scatterplots are easy since they map rows in data tables directly to marks. However, many visualizations first require transforming the data. For instance to create a bar chart showing the counts of donors faceted by sex requires a data transformation to calculated those counts.
{ "source": { "name": "donors", "source": "./data/hubmap/donors.tsv" }, "transformation": [ { "groupby": "sex" }, { "rollup": { "sex_count": { "op": "count" } } } ], "representation": { "mark": "bar", "mapping": [ { "encoding": "x", "field": "sex", "type": "nominal" }, { "encoding": "y", "field": "sex_count", "type": "quantitative" } ] }}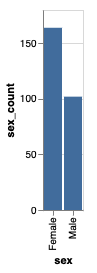
These data transformations can get more complex. For instance to create a relative stacked bar chart with multiple bars can be accomplished with this specification.
{ "source": { "name": "datasets", "source": "./data/hubmap/datasets.tsv" }, "transformation": [ { "groupby": "origin_samples_unique_mapped_organs", "out": "groupCounts" }, { "rollup": { "organ_count": { "op": "count" } } }, { "in": "datasets", "groupby": ["origin_samples_unique_mapped_organs", "assay_category"] }, { "rollup": { "organ_assay_count": { "op": "count" } } }, { "in": ["datasets", "groupCounts"], "join": "origin_samples_unique_mapped_organs", "out": "datasets" }, { "derive": { "freq": "d.organ_assay_count / d.organ_count" } } ], "representation": { "mark": "bar", "mapping": [ { "encoding": "x", "field": "freq", "type": "quantitative" }, { "encoding": "y", "field": "origin_samples_unique_mapped_organs", "type": "nominal" }, { "encoding": "color", "field": "assay_category", "type": "nominal" } ] }}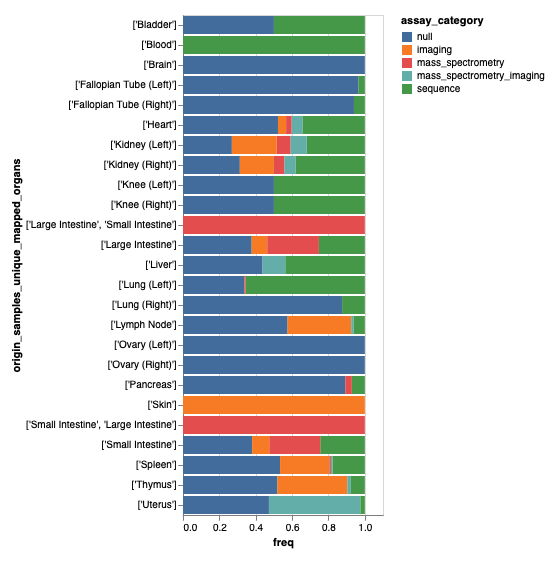
Pre-aggregated data cubes and the only transformation
Section titled “Pre-aggregated data cubes and the only transformation”Some sources are not line-item tables but pre-aggregated powerset cubes: one row per dimension-subset combination, with the dimensions participating in that row populated, every other dimension null, and the measure pre-aggregated over the matching line-item rows. A datapackage resource declares this with three resource-level keys:
{ "name": "encounter_cube", "path": "encounter_cube.csv", "udi:cube": true, "udi:dimensions": ["sex", "race", "age_group"], "udi:measures": ["cnt"]}Reading a cube means picking a marginal — the rows whose populated
dimension set is exactly the one you want. only expresses that:
{ "only": ["sex"] }On the cube above this selects the rows where sex is populated and both
race and age_group are null — i.e. the per-sex totals. {"only": []}
selects the grand-total row. The null complement is resolved from the
source’s udi:dimensions (registered by loadDataPackage), so a spec never
enumerates it; pass dimensions inline to use only against a source whose
metadata isn’t registered.
Filtering a cube is not a matter of adding a predicate. A per-sex chart
reads the sex marginal, in which race is null by construction, so
intersecting it with race == 'White' is provably empty. The correct
operation is expand → filter → contract: read the wider marginal, filter
it, then roll the measure back up to the marginal the chart wants.
"transformation": [ { "only": ["sex", "race"] }, { "filter": { "op": "==", "left": { "field": "race" }, "right": { "literal": "White" } } }, { "groupby": ["sex"] }, { "rollup": { "cnt": { "op": "sum", "field": "cnt" } } }]Contraction is exact for additive measures (counts, sums) and for
min/max. It is not possible for medians or distinct counts, and
means are only correct when count-weighted — so a cube whose measure is
non-additive cannot be filtered this way at all.
Using udi-toolkit
Section titled “Using udi-toolkit”udi-toolkit renders UDI grammar specs as interactive visualizations. It supports three consumption modes:
npm install udi-toolkitimport { UDIToolkit, UDIVis } from 'udi-toolkit';import 'udi-toolkit/style.css';
// As a Vue plugin (registers components globally)app.use(UDIToolkit);
// Or import the component directly// <UDIVis :spec="spec" :selections="selections" @selection-change="onSelect" />Custom Element (any framework)
Section titled “Custom Element (any framework)”npm install udi-toolkit vega vega-lite vega-embed arquero ag-grid-community<script type="module"> import 'udi-toolkit/ce';</script>
<udi-vis id="chart"></udi-vis>
<script> document.getElementById('chart').spec = { source: { name: 'donors', source: './data/hubmap/donors.tsv' }, representation: { mark: 'point', mapping: [ { encoding: 'x', field: 'weight_value', type: 'quantitative' }, { encoding: 'y', field: 'height_value', type: 'quantitative' }, ], }, };</script>npm install udi-toolkit vega vega-lite vega-embed arquero ag-grid-community reactimport { UDIVis } from 'udi-toolkit/react';
function App() { return ( <UDIVis spec={spec} selections={selections} onSelectionChange={setSelections} /> );}Record links (recordUrl)
Section titled “Record links (recordUrl)”recordUrl maps a row to the URL of that record’s own page. It is called with the row and the spec’s first source name. Tables gain a leading ↗ link column, and point marks open the link on a plain click; a Shift, Ctrl or ⌘ click still picks. A row the function returns nothing for gets no link, so an aggregated table has no column. Only http(s) URLs are followed.
<UDIVis spec={spec} recordUrl={(row, source) => row.id ? `https://example.org/${source}/${row.id}` : undefined }/>It is a separate prop, not part of the spec, because the spec is JSON-cloned. On the custom element, set it as a JS property (el.recordUrl = fn). In React, UDIToolkitProvider also takes recordUrl as a default for every nested <UDIVis>. Independently of it, a table cell whose value is an http(s) URL renders as a link. Both kinds of link take their color from the --udi-table-link CSS custom property, falling back to the browser’s link color. The link column stays put while the table scrolls sideways. On a transparent table (the default palette), set --udi-table-surface to the color the table sits on, so the scrolled cells don’t show through the column.
Headless data query (queryData)
Section titled “Headless data query (queryData)”queryData runs a UDI Grammar spec through the same Arquero pipeline that
<UDIVis> uses but returns the resulting rows instead of rendering a chart.
Useful for filtered counts, exports, or any UI that needs the data but
not the visualization. Results are memoized per
(sources, transformations, active selections) tuple so repeat queries
(e.g. brushing back to a previous range) serve from cache.
import { queryData } from 'udi-toolkit/react';
const result = await queryData(  {    source: { name: 'donors', source: '/data/hubmap/donors.tsv' },    transformation: [{ rollup: { count: { op: 'count' } } }],  },  selections,  { displayDataOnly: true }, // skip materializing the full unfiltered table);// result?.displayData → [{ count: 1234 }]
displayDataOnly controls whether the result includes a materialized
unfiltered allData table. When omitted, it defaults to true for
specs whose transformation ends with a rollup (the unfiltered aggregate
is rarely consumed) and false otherwise. For non-rollup specs that
only read displayData (e.g. exports), set it to true explicitly to
skip the expensive second pass.
The function is also exported from udi-toolkit/ce for non-React
consumers.
Pre-loading data and computing domains (loadDataPackage)
Section titled “Pre-loading data and computing domains (loadDataPackage)”<UDIVis> lazy-loads each CSV the first time a chart references it. If
your app already knows the full set of datasets up front (e.g. a data
package manifest), loadDataPackage fetches each URL once, parses it
on the main thread (so the parsed table is cached for <UDIVis> to
reuse — no re-fetch), and computes per-field domains in a dedicated
Web Worker. Domains stream back per entity as they finish:
import { loadDataPackage } from 'udi-toolkit/react';import type { DataFieldDomain } from 'udi-toolkit/react';
const allDomains: DataFieldDomain[] = [];
await loadDataPackage(  [    { name: 'donors', url: '/data/hubmap/donors.tsv' },    { name: 'samples', url: '/data/hubmap/samples.tsv' },    { name: 'datasets', url: '/data/hubmap/datasets.tsv' },  ],  {    onEntityDomains: (entityName, domains) => {      allDomains.push(...domains);    },    onError: (entityName, message) => {      console.error(`Failed to load ${entityName}: ${message}`);    },  },);// At this point every <UDIVis> referencing one of these entities by// name will reuse the parsed table from the shared cache — no re-fetch.
Each DataFieldDomain has the shape:
interface DataFieldDomain { entity: string; field: string; type: 'interval' | 'point'; domain: { min: number; max: number } | { values: string[] }; fieldDescription: string;}loadDataPackage falls back to a main-thread compute path if Worker
construction throws (e.g. restrictive CSP). The same function and
types are exported from udi-toolkit/ce for non-React consumers.
Reacting to selections without re-rendering (subscribeToSelections)
Section titled “Reacting to selections without re-rendering (subscribeToSelections)”All selections — both Vega brushes (written directly by <UDIVis>’s
signal handlers) and external filters bound via queryData’s
selections argument — live in a single shared Pinia DataSourcesStore.
Brush events fire at up to 60 Hz; mirroring them into a React store just
to trigger an effect causes pointless re-renders. subscribeToSelections
exposes the Pinia change feed directly:
import { subscribeToSelections, clearAllSelections } from 'udi-toolkit/react';
useEffect(() => {  let unsubscribe: (() => void) | null = null;  let cancelled = false;  subscribeToSelections(() => {    // fires on every selection change — brush ticks AND programmatic updates    triggerMyQueryPump();  }).then((u) => {    if (cancelled) u();    else unsubscribe = u;  });  return () => {    cancelled = true;    unsubscribe?.();  };}, []);
The returned unsubscribe is wrapped in a promise because ce-entry (and
the shared Pinia singleton) lazy-load on first udi-toolkit call; the
callback fires synchronously once subscribed.
clearAllSelections() wipes every active selection — useful for
“reset session” flows so stale bookkeeping entries from closed
visualizations don’t accumulate across resets. Brushes themselves are
already cleared by Vega when a chart unmounts.
Both functions are also exported from udi-toolkit/ce for non-React
consumers — they return a synchronous unsubscribe / void there since
ce-entry is already imported.
Development
Section titled “Development”From the repo root, udi-toolkit is consumed by the chat app and the grammar
demo app as workspace:* (its exports point at dist/), so build the
toolkit before building or typechecking its consumers:
pnpm build:toolkit # from the repo root# or, scoped to this package:pnpm --filter udi-toolkit build:allWorking inside this package (packages/grammar):
pnpm build:all # Builds Vue, Custom Element, and React targetspnpm test # Builds + runs smoke testspnpm build-schema # Regenerates UDIGrammarSchema.json from GrammarTypes.tsStorybook
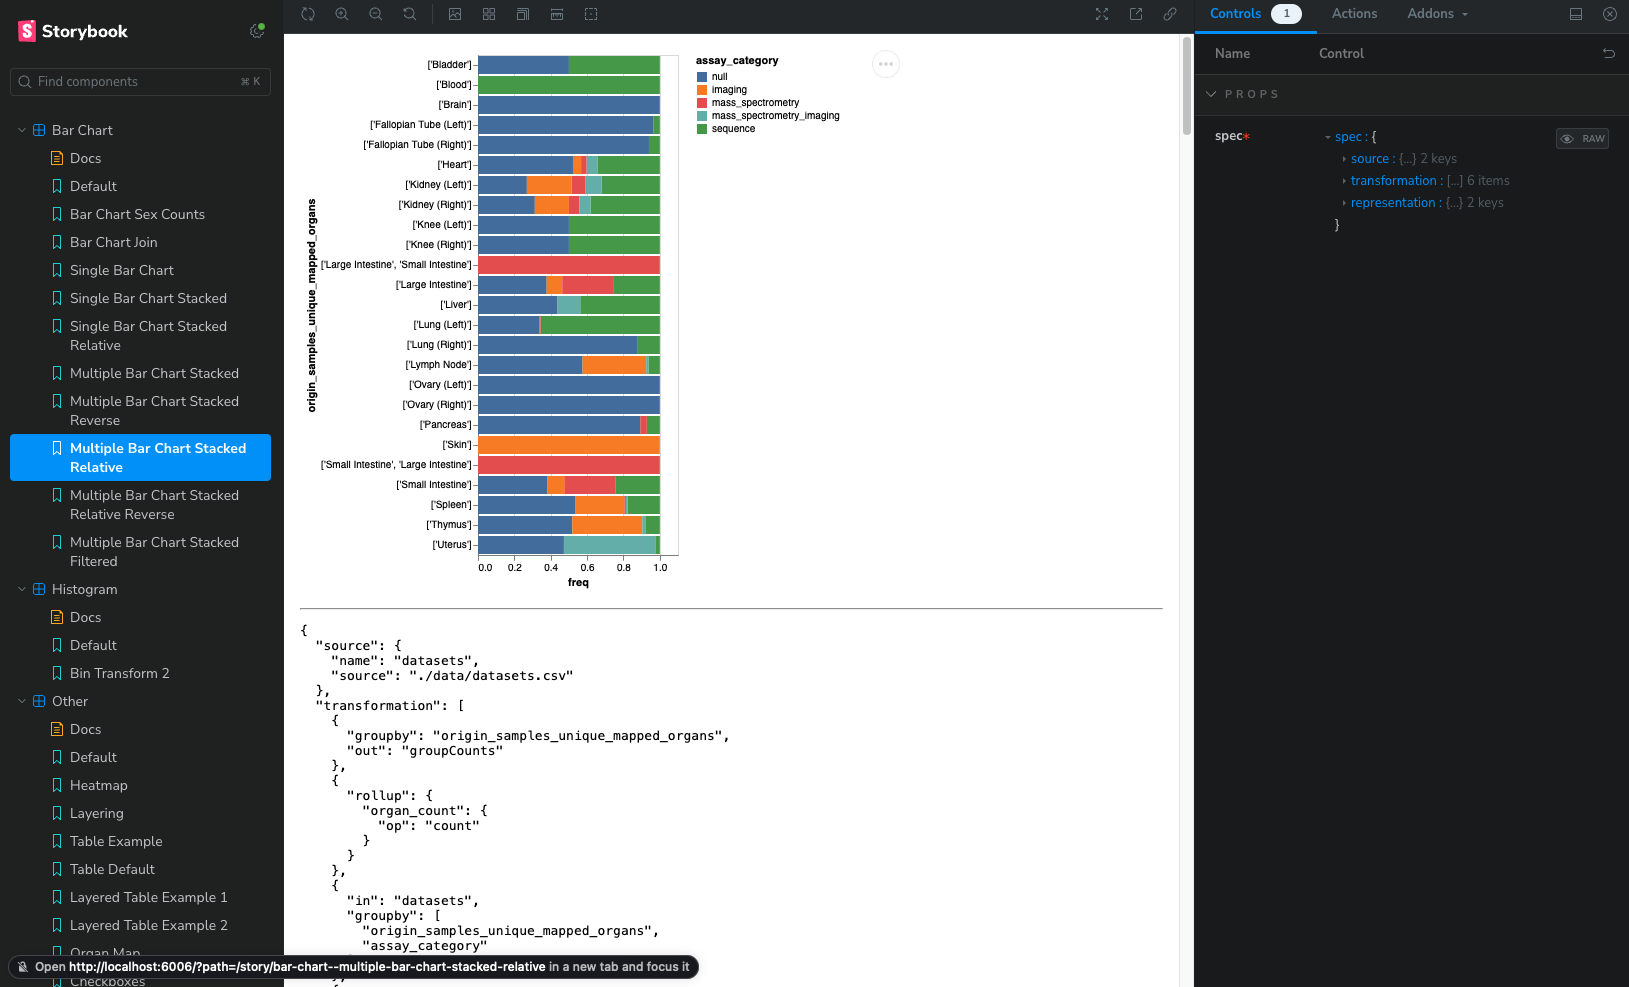
Section titled “Storybook”The toolkit uses Storybook to develop and test the
grammar with individual stories. Run pnpm storybook (or pnpm dev:storybook
from the repo root) to browse the stories at http://localhost:6006.
For an interactive spec editor built on the toolkit, see the grammar editor on the docs site, alongside a tutorial and live examples.