The UDI grammar
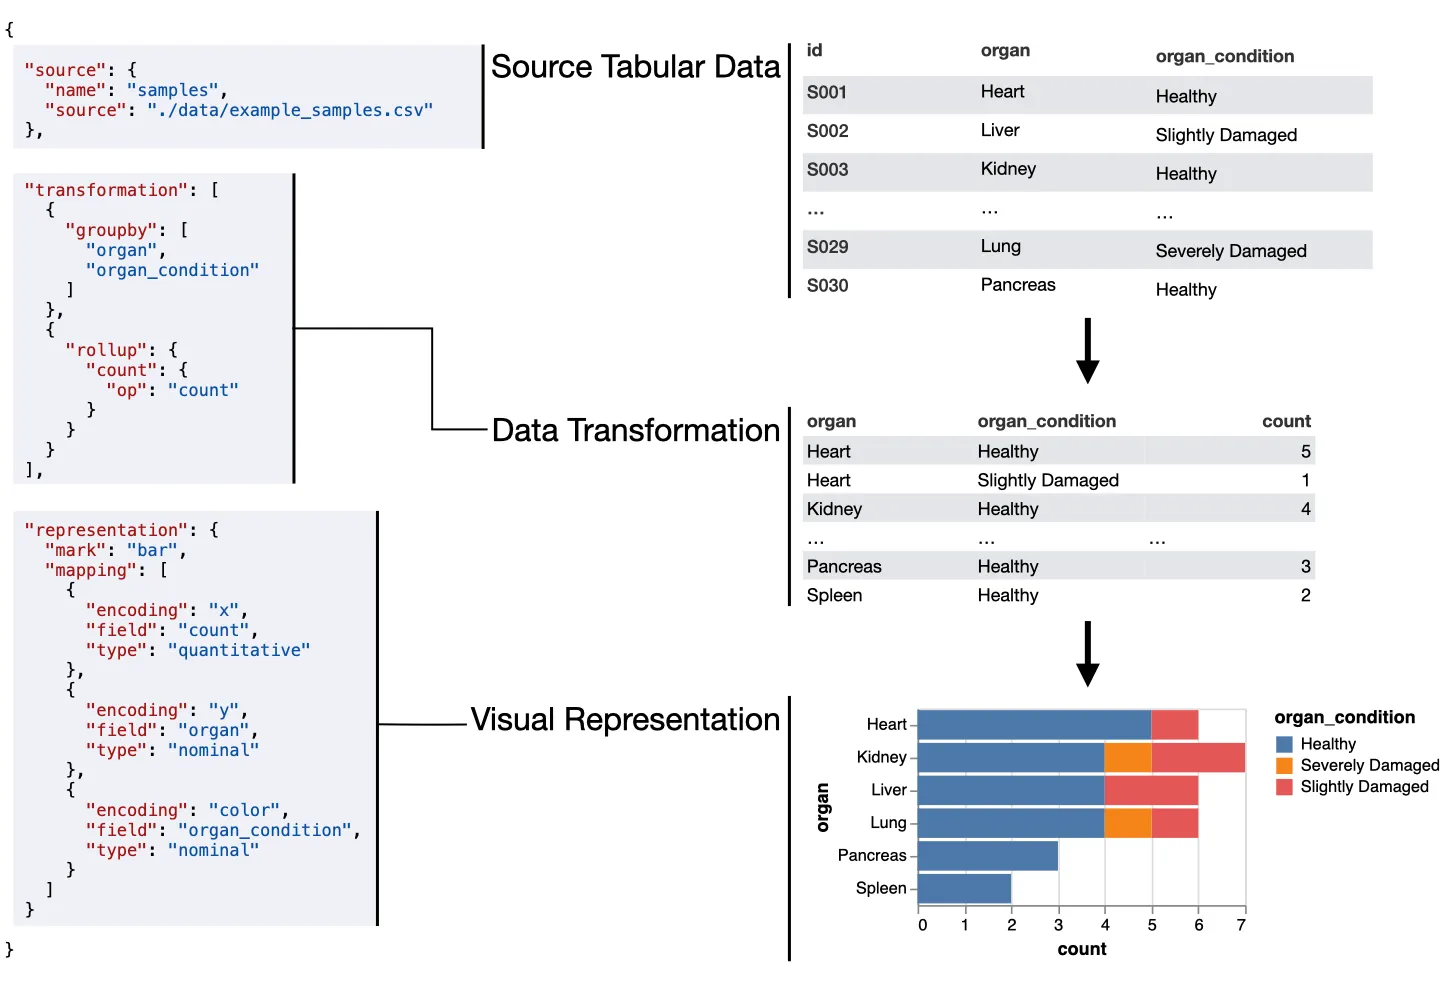
The Universal Discovery Interface is a research project that aims to improve biomedical data portal interfaces. An essential component is its visualization grammar, a JSON format that can describe many different visualizations. Every chart in YAC is a grammar spec, rendered by the udi-toolkit component.
The grammar uses principles from The Grammar of Graphics, which also underlies libraries like Vega-Lite and ggplot2. A spec has three sections:
sourcedefines the tabular data sources.transformation(optional) reshapes the source data: grouping, aggregating, joining, deriving and filtering.representationmaps fields of the transformed data to visual encodings, as chart marks or table rows.
TutorialBuild a heatmap of HuBMAP datasets step by step.
ExamplesTables, bar charts, scatterplots, heatmaps and distributions.
HuBMAP examplesCharts of live metadata from the HuBMAP Data Portal.
EditorWrite a spec and see the chart as you type.
The full reference for every field is in the grammar toolkit docs.